





What Happened
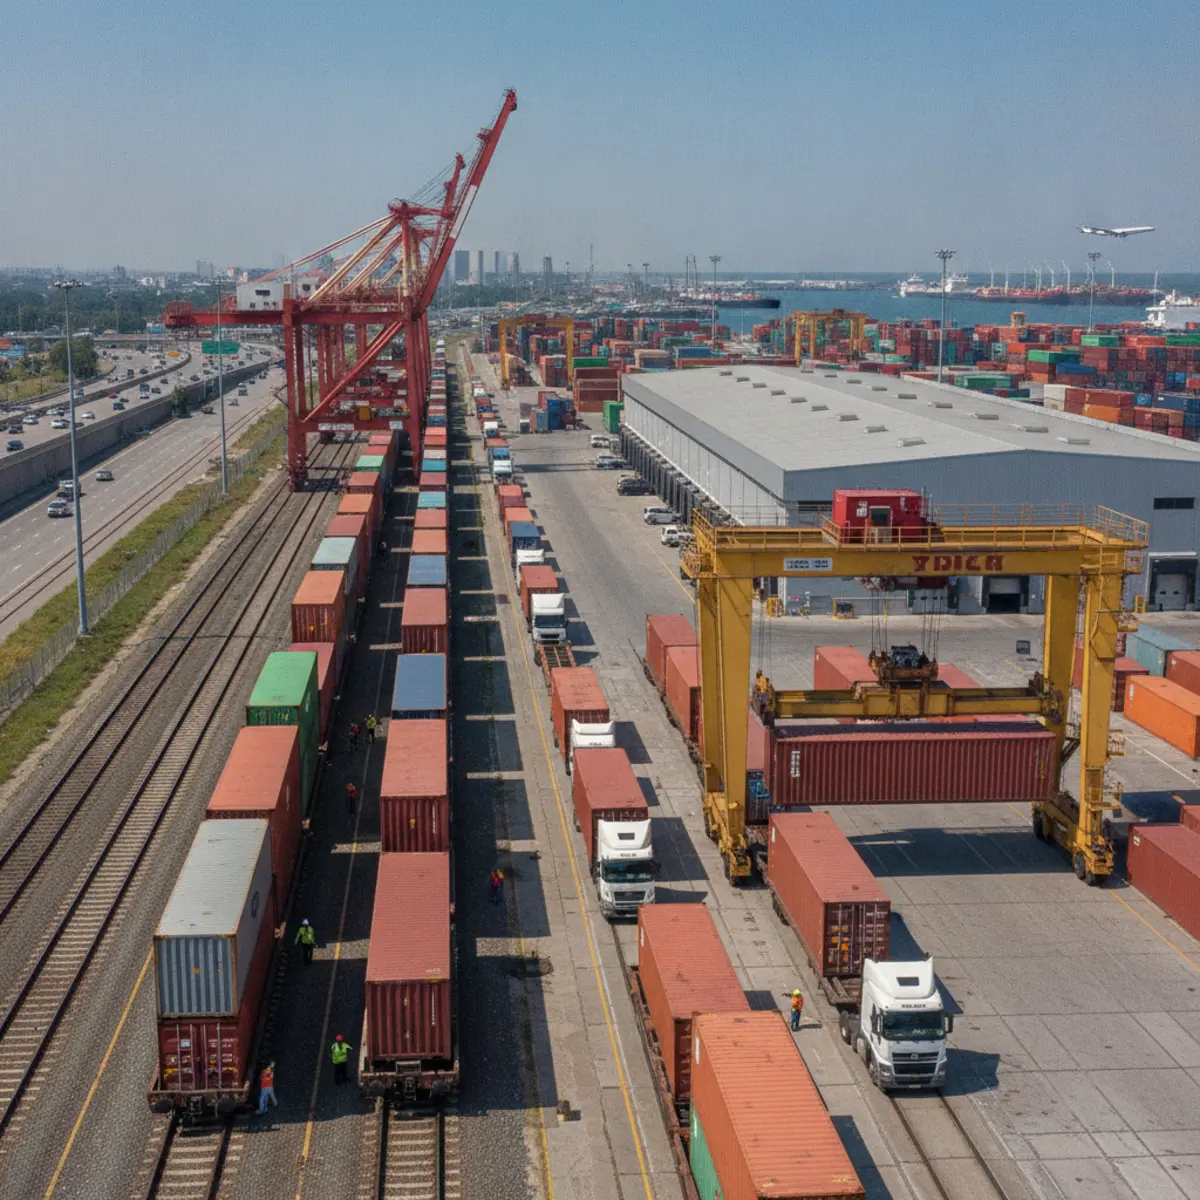
July US rail carloads rose 0.5%, an increase of 6,176 carloads, to 225,977, the seventh consecutive month of growth. That figure comes from the July edition of the Association of American Railroads Rail Industry Overview, reported by Logistics Management. Total July intermodal volume reached 286,647 containers and trailers, up 6.1% year on year and rising for the sixth straight month, setting a new July record. The AAR publishes the overview monthly and covers both bulk carload traffic and containerised intermodal movements across the US network.
Published: Tue, 11 Aug 2026 Source: Logistics Management
What Record US Intermodal Volumes Mean for UK Exporters
UK exporters selling into the United States feel this in inland transit planning rather than at the discharge port. Cargo landing at New York, Savannah, Charleston or Los Angeles and moving inland by rail is now competing for space on a network carrying record July intermodal volume, on the AAR data reported by Logistics Management. Where you sell on DAP or DDP terms to an inland buyer, the rail leg sits with you, and tighter ramp capacity shows up as dwell before the container moves. Forwarders arranging combined transport services into the US interior are quoting against that background.
The two numbers are not telling the same story. Carload traffic, which covers bulk commodities such as coal, grain, chemicals and steel, grew by only 0.5%. Intermodal, which is where containerised import and export freight sits, grew by 6.1% and set a July record at 286,647 units. That gap points to container flows rather than bulk driving current railroad momentum. For UK shippers the intermodal line is the one that matters, because it tracks the same boxes leaving Felixstowe, Southampton and London Gateway for US ports.
Watch the AAR overview for whether intermodal growth holds into the autumn, when Asia to US import volumes typically peak and compete for the same railroad capacity. Ask your forwarder to confirm in writing which party controls the US inland leg, what the quoted transit actually covers, and whether the rate is fixed to a named ramp such as Chicago, Dallas or Memphis. Where a 40ft container has to reach a Midwest delivery point on a firm date, price the road alternative alongside it so you hold a fallback that does not depend on ramp availability.
What to Take From the AAR Figures
US intermodal volume set a July record of 286,647 containers and trailers while carloads rose 0.5% to 225,977, on AAR data reported by Logistics Management. If your delivery point sits inland, treat the rail leg as a priced, dated part of the shipment rather than a detail behind the ocean freight.
Market Impact for UK Importers and Exporters
Sustained intermodal growth changes where the risk sits in a US door delivery. Ocean transit from UK ports to the US East Coast is the predictable part of the journey; the variable part is how quickly a box is lifted from the terminal onto rail and how long it waits at the destination ramp. Six consecutive months of intermodal growth, on the AAR figures, means less slack in that system, and less slack usually means quoted door transits need wider tolerances than they did earlier in the year.
There is a cost dimension as well. Containers sitting longer at ports or ramps accrue demurrage and detention, and those charges fall on whichever party holds the Incoterms 2020 obligation for that leg. Check your terms of sale before the autumn, confirm free time on both the ocean carrier’s bill of lading and the inland move, and make sure commercial invoices and commodity codes are correct at the outset so customs release does not add avoidable days on top of a network already running at record July volume.