




What Happened
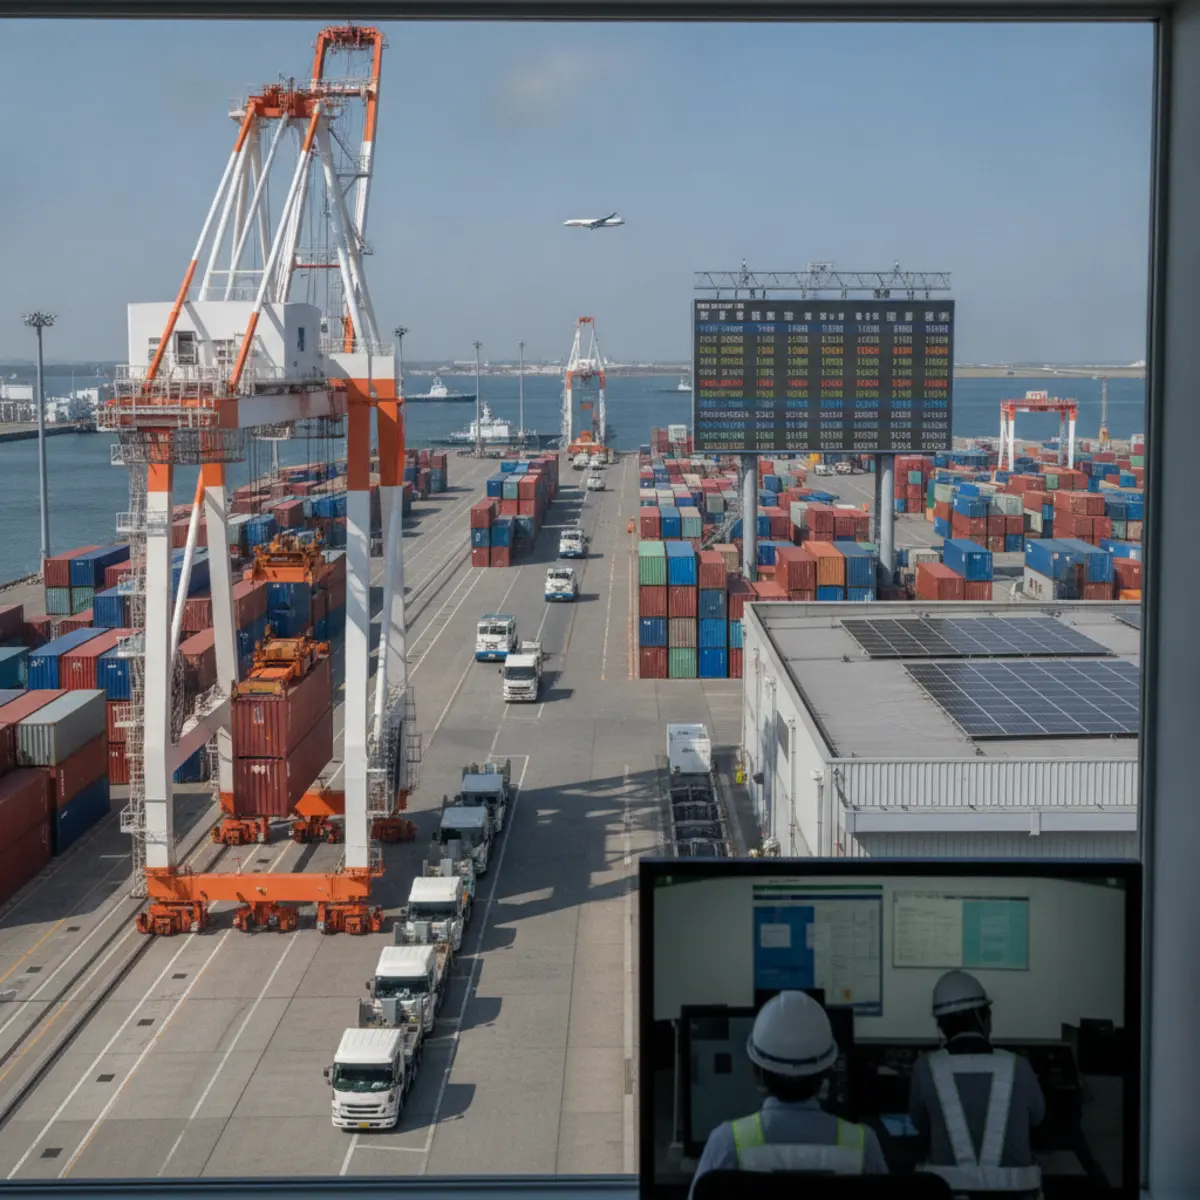
Japan’s Ministry of Land, Infrastructure, Transport and Tourism (MLIT) has begun publishing a weekly container throughput report covering 6 of the country’s major ports, Container News reports. The first Container Cargo Flow Weekly Report was issued on 18 September 2026, using data collected through a Japanese government digital port data platform. MLIT’s stated aim is to give a faster picture of changes in international container flows than the monthly figures already available. Container News does not publish first week volumes for the 6 ports, and the series as described covers throughput rather than freight rates or vessel schedules.
Faster Japanese Data, Earlier Warning for UK Importers
For UK importers buying from Japan, the value here is timing. Sailings from Japan’s main container ports to North European hubs typically run 30 to 40 days port to port, so a change in loadings shows up at Felixstowe, Southampton or London Gateway roughly 5 to 6 weeks later. A weekly series shortens the warning period. Instead of waiting on monthly statistics published in arrears, you can see a shipping container volume swing while your own cargo is still being booked, and adjust ordering, warehouse labour and collection dates.
The launch sits inside a wider push for higher frequency trade data. During the congestion of 2021 and 2022, and again after the Red Sea diversions from late 2023, monthly port statistics lagged real conditions by weeks, and buyers priced capacity on stale numbers. Weekly national throughput does not add capacity, but it narrows the gap between an event and the evidence for it. That gap matters most to businesses buying container freight services on quarterly or annual contracts, where a rate decision commits volume months ahead.
Two checks are worth building into your routine. Compare the weekly Japanese figures against your carrier’s schedule reliability on the Asia to North Europe trade, because throughput records what moved, not whether it moved on time. Then treat any single week as noise and read the 3 or 4 week direction instead, particularly around the Golden Week and New Year closures that compress Japanese export bookings every year. Watch also for whether MLIT extends the series beyond the 6 ports it covers now.
What to Take From This
MLIT has confirmed a weekly container throughput report for 6 major ports, starting 18 September. It carries no rate information, but for UK importers it turns Japanese shipping container flows into a 7 day signal rather than a monthly one, which is enough to sharpen booking decisions and warehouse planning.
Market Impact
Better data does not shift rates on its own. What it changes is who is arguing from evidence when a carrier announces a general rate increase or blanks a sailing on the Asia to North Europe loop. An importer who can point to 3 consecutive weeks of falling Japanese throughput is in a stronger position when a surcharge lands than one working from a monthly figure published 5 weeks after the fact. The effect is small per booking and cumulative across a year of volume.
For exporters, the series doubles as a demand read on a market that still matters to UK machinery, drinks and vehicle parts sellers. Japan is a long transit lane whichever routing you use, so an earlier view of shipping container handling at the 6 ports helps you judge whether to consolidate into a full container or keep shipping groupage. Expect analysts to compare the Japanese series against Chinese and Korean throughput once several weeks of data have accumulated.
Reported by the Plexus Freight team, from Container News.
Source: https://container-news.com/japan-launches-weekly-container-throughput-data-for-six-major-ports/